How Your Sales Team Benefits from a Dynamics 365 Sales Forecast (Part 2)
Dynamics 365 for Sales offers a lot of nice features to facilitate managing your business opportunities. Over the years, SyncraTec has compiled a list of recommended customizations to the out of the box Opportunity Sales Process that add a lot of value to opportunity management. And now, Dynamics 365 for Sales has added sales forecasting to increase the probability of success for your sales team even more!
It’s beneficial for a sales manager to have access to a list view of open opportunities that their team is nurturing. Dashboards and charts can improve the data visualization of these opportunities by such things as Estimated Revenue, Estimated Close Date and Probability. But, a sales forecast can help a sales team track their performance against their targets and identify risks to achieving their quotas. My previous blog highlighted how simple it is to set up and configure a sales forecast for your organization in Dynamics 365.
This blog will demonstrate how sales team members and sales managers can use forecasts to achieve their sales goals. All of the functionality discussed in this blog comes FREE with Dynamics 365 for Sales, along with some additional Sales Insights functionality.
Viewing and Adjusting a Forecast as a Sales Team Member
A sales manager needs to have the Forecast Manager security role to configure forecasts for their organization. They can set up the type of forecast, permissions for accessing it, and the columns they want displayed on the forecast grid. After a forecast is activated, the sales team members can access the projected revenue and pipeline predictions accumulated from their opportunities. A sales team member will find forecasts in the Performance area of the navigation menu of the Sales Hub app.
The drop-down list of forecasts at the top will display any forecast for which the sales team member has permissions to view. From the next drop-down list, they can choose the forecast period they want to see. These options reflect the forecast periods defined in the forecast configuration.
The Forecast Grid
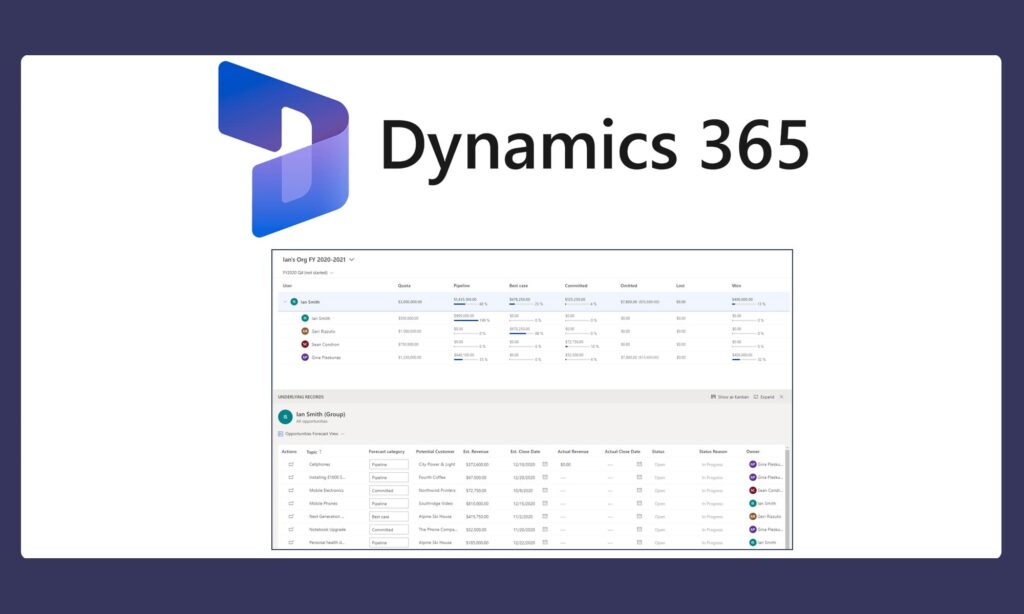
The forecast grid displays all relevant columns as defined in the forecast configuration. The totals are aggregated by user or by territory, at each level of the hierarchy and for each period according to the forecast column attributes. The forecast illustrated in this blog was configured as an “org chart forecast”. It also uses the out-of-the-box Forecast Category option set from the Opportunity entity for column configuration (recommended by Microsoft).

As a sales team member, the forecast grid summarizes opportunity values from a snapshot of the data. The upper right corner may indicate that “Fresh data is available”. Dynamics gives the user the option to update the grid with the real time values from their Opportunity records. It will include Opportunities where the user (sales team member) is the Owner and the Estimated Close Date falls within the forecast period. The default value for each column is the sum of the Estimated Revenue fields for all the Opportunities with the Forecast Category value indicated by the column name. Note: There are some changes around snapshot history in Dynamics Release 2020 Wave 2.
Underlying Opportunity Records


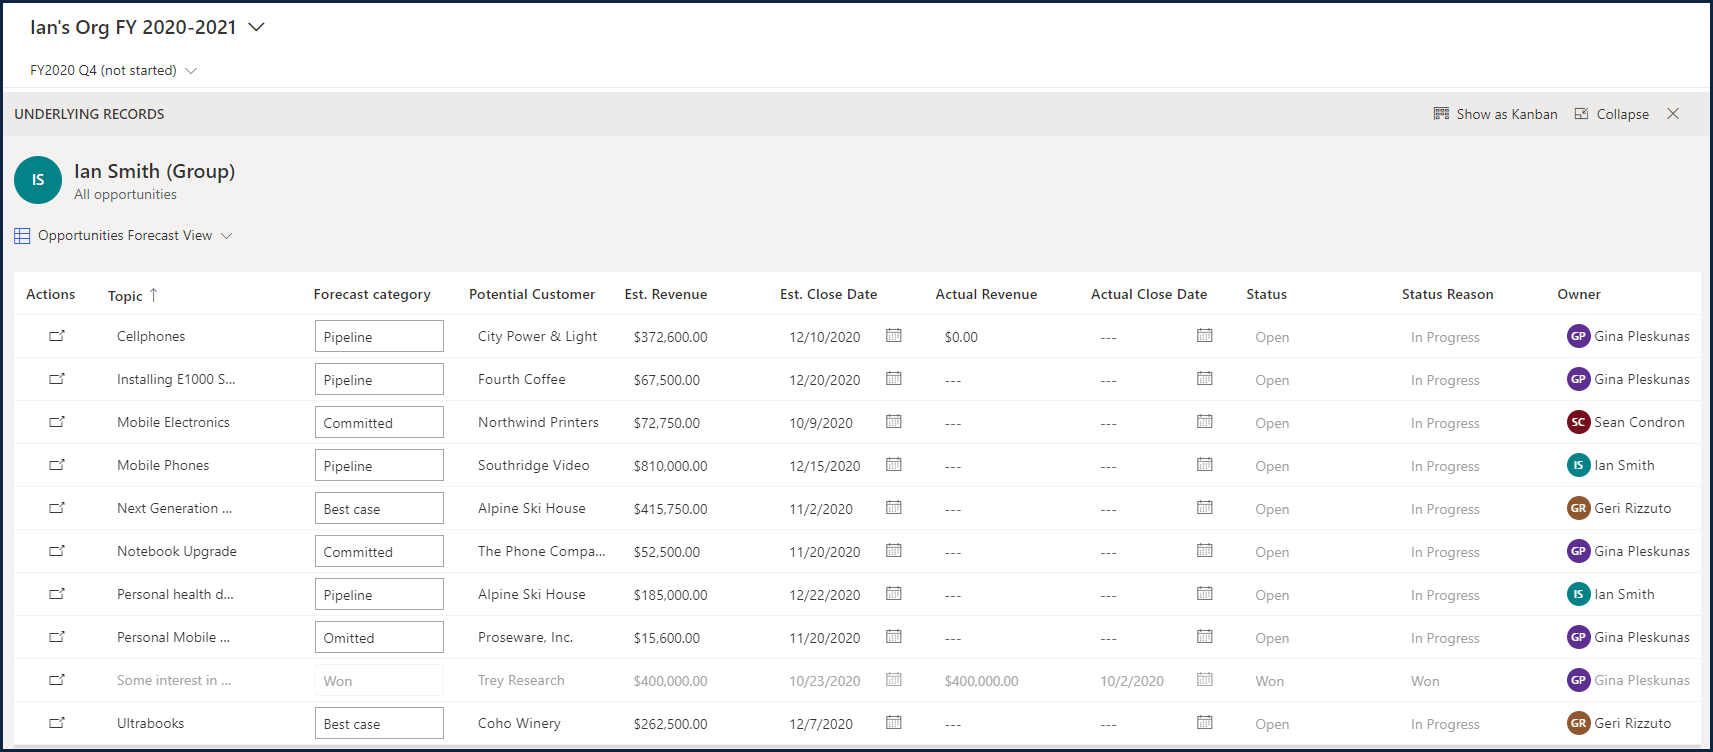
At the bottom of the forecast, you will see the underlying Opportunity records in the Opportunities Forecast View. This is the out-of-the-box default view, but it can be changed when the forecast is configured. From this Opportunities Forecast View, the sales team member can:
- Update the “Forecast category” column to:
- Pipeline – indicates with low confidence that this Opportunity will be closed as won during the forecast period (default value for new Opportunities)
- Best case – indicates with medium confidence that this Opportunity will be closed as won during the forecast period
- Committed – indicates with high confidence that this Opportunity will be closed as won during the forecast period
- Omitted – identifies an Opportunity that the user wants to be excluded from the estimated revenue forecast values
- Note: An out-of-the-box workflow automatically updates the Forecast Category to Lost or Won when an Opportunity is closed as lost or closed as won.
- Update additional Opportunity fields, such as Topic, Potential Customer, Est. Revenue, and Est. Close Date.
- Select “Show as Kanban” to display the underlying records in a Kanban type of view to easily drag Opportunity records from one Forecast Category to another.
- Select “Expand” to see more of their Opportunity records at one time.
- Navigate to the Opportunity record by clicking on the icon in the “Actions” column on the far left. The Opportunity form is opened in a new window to allow the update of any Opportunity record field while staying within the context of the forecast grid.
Adjusting the Forecast
The columns in the forecast grid can be configured different ways. It is up to the sales team manager to design the forecast grid to facilitate getting the most out of the forecast for their business. The forecast grid created for this blog provides the following functionality:
- Clicking on a Forecast Category column in the forecast grid will filter the view of underlying Opportunities accordingly.
- Column descriptions appear as tooltips on the column header to help the users understand what that value represents.
- Specific columns, like Committed in this forecast grid, have been configured to allow manual adjustments to the system-calculated values.
- Specific columns, like Pipeline in this forecast grid, have been configured to display a progress bar indicating the attainment percentage compared to the quota column.
From the Underlying Records view, a user can modify the individual Opportunity Forecast Category directly in the view. When this occurs, the Estimated Value of the Opportunity will be subtracted out of the previous Forecast Category roll up value and added to the new Forecast Category roll up value.
Adjustment Dialog Box
There may circumstances where the sales team member estimates the amount that they expect an Opportunity to bring in at the close of a forecast period to be different from the roll up value. They may want to adjust the system-calculated rollup value. If the column is configured to be adjustable, a user can hover over the field and select the pencil icon that appears.
A dialog box appears (above left) that is defaulted to the Adjustment tab. The user can then enter an adjustment amount and a note describing the reason for the adjustment. After the “Adjust” button is selected (above center), the system-calculated value is still displayed with the adjusted amount directly above it. There is also an option to reset the forecast category value back to the system-calculated value. At any point, you can see the adjustment history (above right) by clicking on the History tab in the dialog box.
Viewing and Adjusting a Forecast as a Sales Manager

For a sales manager, the forecast grid displays the hierarchy of users as defined by the Manager field on the User records. This is assuming that the forecast was configured using the “Org chart forecast” template. The forecast grid can display multiple levels of the hierarchy, if an organization is structured that way.
The sales manager can see how their team is performing in meeting their sales team targets. In addition, the sales manager can track how well each of their sales team members is contributing to the team’s success. If a sales manager sees the need to make manual adjustments, they can do so. Sales managers have the ability to adjust their own or a direct report’s forecast. For example, the sales manager may think that a direct report underestimated their “Best case” Opportunities. In this case, they can increase the value in the forecast grid for that sales team member. Once saved, the adjustment will be rolled up to the parent record and all the way up the hierarchy.
A sales manager can select a row or a cell for any level of the hierarchy to see the related underlying opportunities. They can identify whether the underlying opportunities belong to a team, an individual, a single cell value, or a full row by looking at the table heading. The expanded view of underlying opportunities below is labeled as a “(Group)” view, i.e. opportunities belonging to the team.


Conclusion
This blog highlights the features and benefits to a sales team in maintaining a simple Dynamics 365 sales forecast model. If you have an interest in more sophisticated ways to project sales revenue more accurately with AI powered forecast predictions and interactive snapshot comparisons, check out the premium forecasting capabilities that are available in Dynamics 365. In addition, there are enhancements planned for sales forecasting that are available in preview mode with Release 2020 Wave 2. These improvements include supporting opportunity splits and breaking down the forecast by product family.


