

How to Set Up a Dynamics 365 Sales Forecast Model (Part 1)
A sales forecast can help sellers track their performance against their targets and identify risks to achieving their goals. This blog (Part 1) is going to highlight how easy it is to set up a sales forecast for your organization in Dynamics 365. All of the functionality discussed in this blog comes FREE with Dynamics 365 Sales, along with additional Sales Insights functionality. By default, the sales forecast model is available in your organization.
You need to be an administrator or have the Forecast Manager security role to configure forecasts in your organization. You can set up the type of forecast, permissions for accessing it, and the columns you want displayed on the forecast grid. After a forecast is activated, your sales team can access the projected revenue and pipeline predictions.
Getting Started with Your Sales Forecast Model
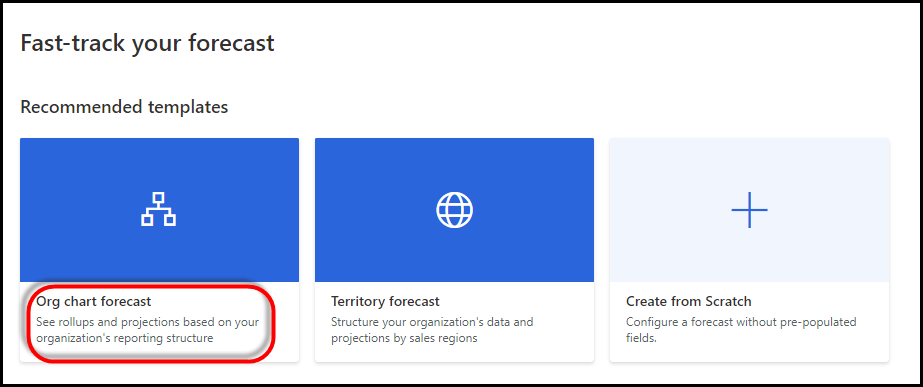
You can set up Dynamics 365 sales forecast models based on your organization’s reporting hierarchy, your organization’s sales regions or some other hierarchy entity. For this blog, we are going to base our forecast on our organization’s reporting structure. Note that this method assumes that Manager (User lookup) fields are already updated on User records.
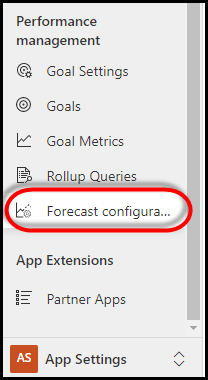
From the App Settings menu of the Sales Hub, select “Forecast configuration”, then choose the “Org chart forecast” template.
General Properties
The template is a wizard-like tool that will guide you through the configuration of your org chart forecast. Here is a list of the properties you will need to identify.
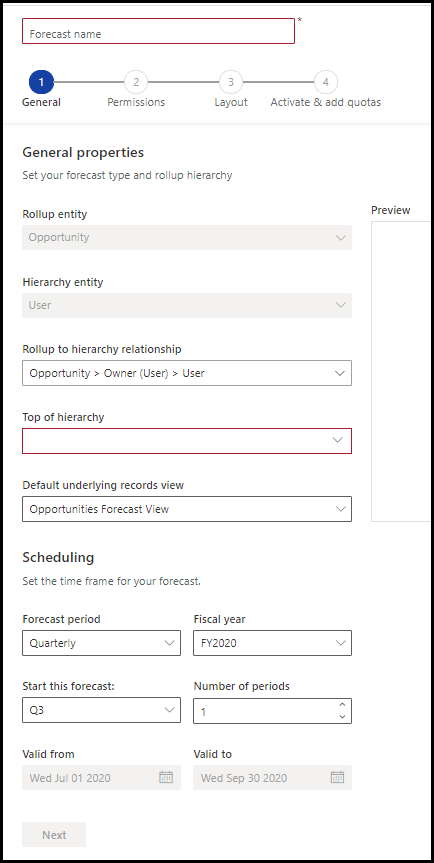
Forecast name – enter a meaningful name
Rollup entity – this is set to Opportunity by default and cannot be changed
Hierarchy entity – this is set to User by default and cannot be changed
Rollup to hierarchy relationship – defines the relationship between the rollup entity and the hierarchy entity (e.g. Owner)
Top of hierarchy – for org chart forecasts, provides a drop down of Users – select the Manager – after you select the Manager, the Preview window on the right will show the hierarchy
Default underlying records view – provides a drop down of Opportunity views – this is the view used when users select a row or a cell of the forecast to view its underlying Opportunities (more about this in Part 2 of this blog)
Forecast period – select whether the forecast is generated monthly or quarterly
Fiscal year – select the fiscal year for the forecast – this is populated based on the organization’s fiscal year settings
Start this forecast – select the time period to start forecasting –
Number of periods – enter the number of forecast periods to be generated – you can only create forecasts that span up to one year
Valid from – read-only field – it identifies the date the forecast starts
Valid to – read-only field – it identifies the date the forecast ends
When you are done, click on the “Next” button.
Permissions
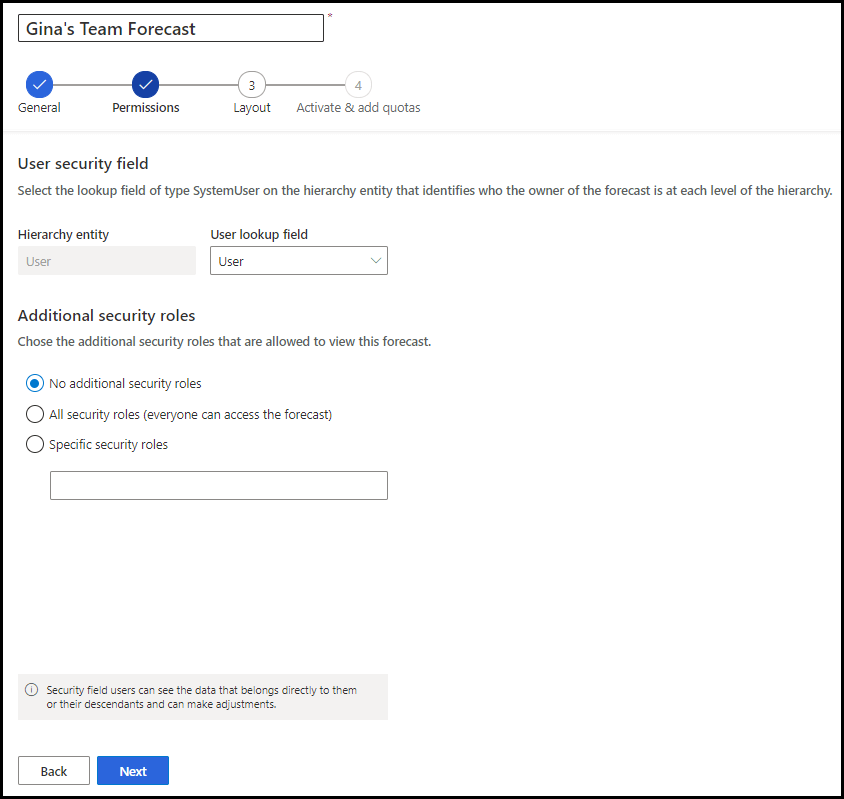
In the Permissions step of the forecast wizard, you identify which users can view and adjust the forecast data at each level. Also, you can provide access to users who have specific security roles to view the forecast.
In the User security field section, the User lookup field will default to “User” for org chart forecasts. This field determines the owner of the row in the forecast grid. If you select a value other than the default, a column is created in the forecast grid.
The Additional security roles section provides options to give permissions to users outside of the organization hierarchy. By default, “No additional security roles” is selected.
Layout and Columns
In the Layout step of the forecast wizard, you can configure columns to define the rows in the forecast grid. Every forecast needs an option set to define roll-up columns. You can add roll-up columns based on option set values that are defined for your Opportunities. Click the + Add from option set to get a list of the option sets defined on the Opportunity entity. Select an option set, and then click on Choose selected. Each option set value you select is added as a column for you to configure.
Forecast Category
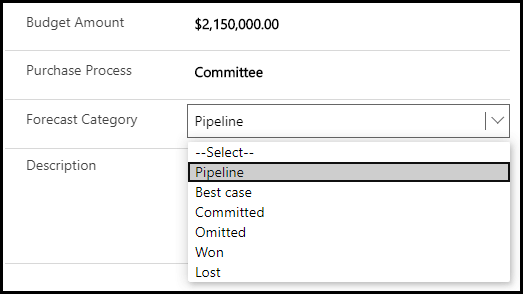
Microsoft recommends using the out-of-the-box Forecast Category option set for column configuration. Forecast Category is an out of the box field displayed on the Opportunity form. It is used to define the confidence level of an Opportunity closing as a win. It defaults to “Pipeline”. You can add custom option set values, if you’d like. As you can see below, the Forecast Category options include Won and Lost. The Opportunity Forecast Category Mapping Process is an out-of-the-box workflow that automatically updates the forecast category when an Opportunity is set to Won or Lost. If you’re using a custom option set for column configuration, you must create a workflow to ensure that the forecast is projecting accurate values.
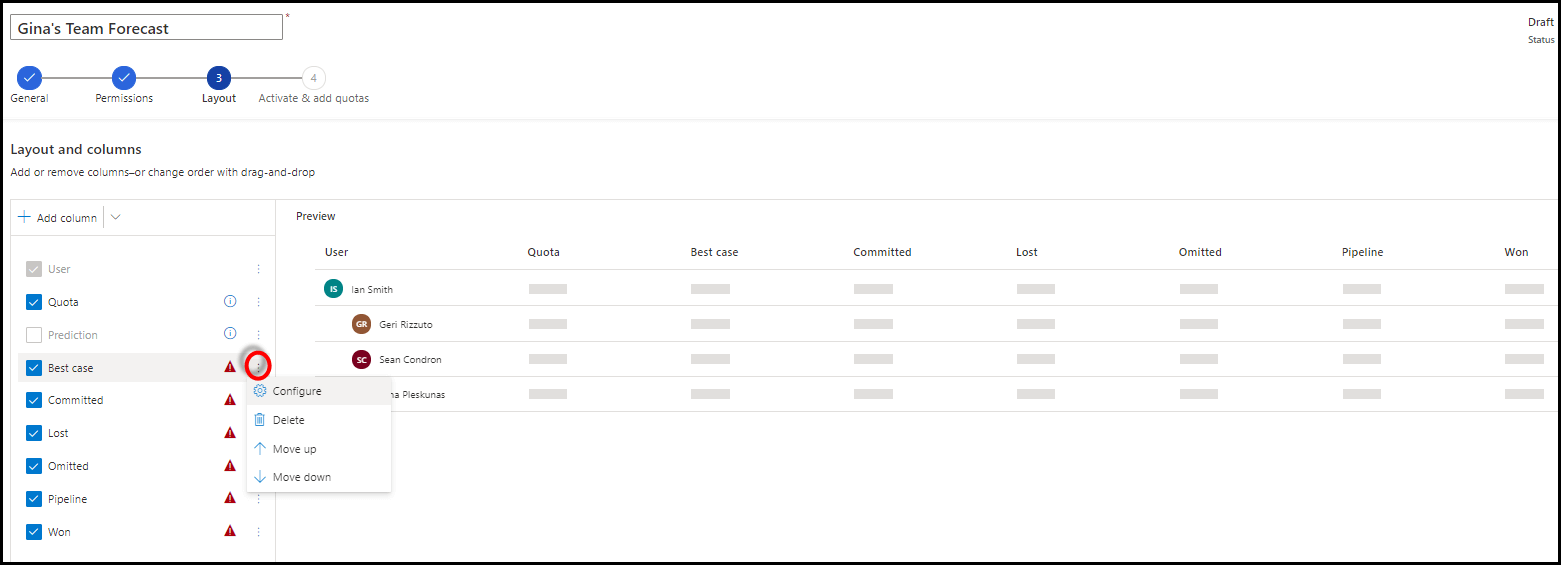
After your columns are added, you can configure each one by clicking on the vertical ellipsis and selecting Configure. This will give you the ability to
- modify the column Name
- set the column Type (typically Rollup)
- define the Amount field (what you are rolling up, typically the Estimated Revenue)
- define the Date field (the date used to determine the forecast period, typically the Estimated Close Date)
- add a Description (this appears as a tooltip on the column header of the forecast grid)
- set Allow adjustments (to let users manually edit a system-calculated value directly in the forecast grid, indicated by a pencil icon)
- enable Show progress compared to quota (to compare the column’s value against the quota column indicated by a percentage shown in a progress bar)
- set Show in Trend Chart
There is an Auto-Configuration option that would do a lot of the column configuration for you. You can always tweak it afterwards.
Additional Filters
By setting additional filters, you can filter the Opportunity records used to calculate the forecast values. The filters are based on attribute values that belong to the Opportunity entity, including related entity attributes.
Activate & Add Quotas to your Sales Forecast Model
Activate Forecast
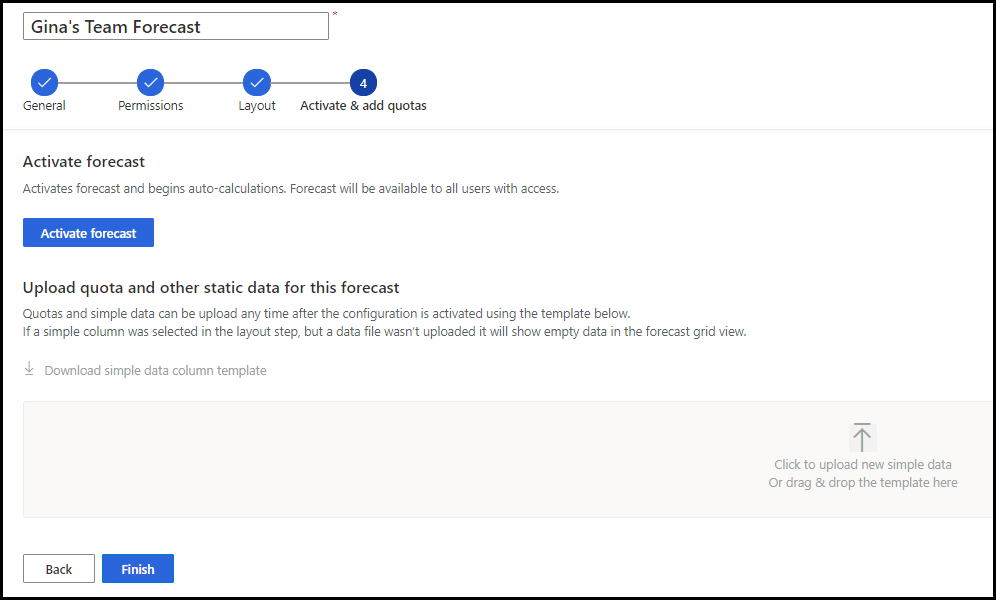
After reviewing and confirming your forecast layout and columns, you simply click on the “Activate forecast” button. The forecast will start calculating the forecast values and become available to users. The system will display a confirmation message after the forecast model is activated. At this point, the “Download simple data column template” is enabled.
Upload Sales Forecasting Quota Data
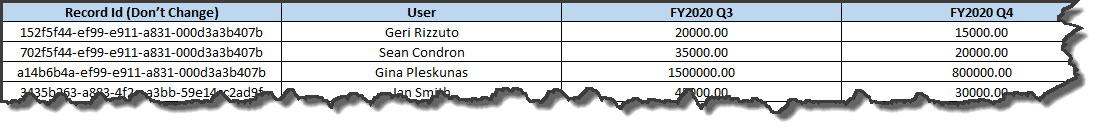
The system generates a quota template with a column for each forecast period and a row for each user in the hierarchy. The sales manager must update the Excel quota template appropriately for each user. After the quota template is uploaded, managers and users can begin tracking targets.
Sales Forecast Model Configuration Results
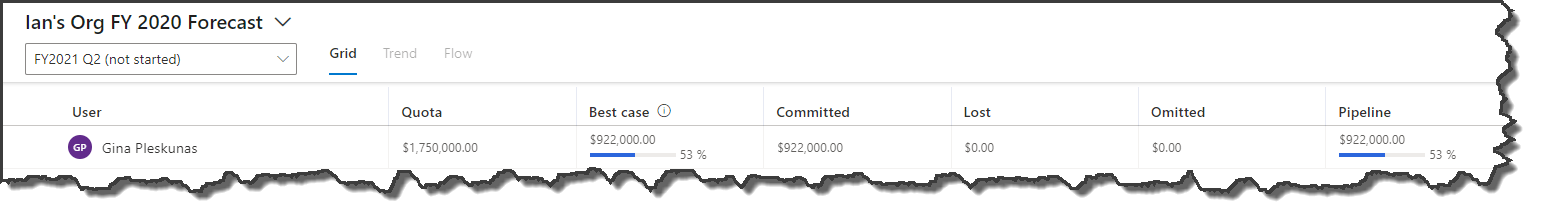
Here is an example of a sales forecast grid that a user could see in their activated forecast. Note, that a manager would see a row for each of the users of their hierarchy.
This blog highlights the steps to create a simple Dynamics 365 sales forecast model. However, even with the FREE version of Sales Forecasting, there are more options in configuring a forecast than what I’ve detailed here. If you have an interest in more sophisticated ways to project sales revenue more accurately with AI powered forecast predictions and interactive snapshot comparisons, check out the premium forecasting capabilities that are available in Dynamics 365.
Part 2 of my blog will highlight how managers and users can use forecasts to analyze their sales performance, identify risks and make adjustments to improve their ability to achieve their sales goals.


No comment yet, add your voice below!