How Your Sales Team Benefits from a Dynamics 365 Sales Forecast (Part 2)
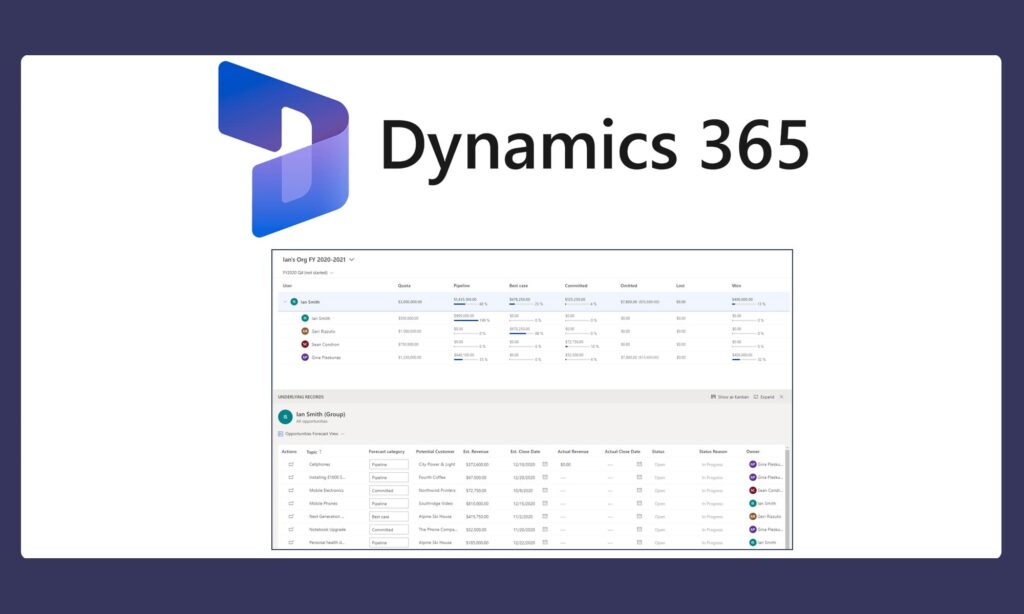
How Your Sales Team Benefits from a Dynamics 365 Sales Forecast (Part 2) Dynamics 365 for Sales offers a lot of nice features to facilitate managing your business opportunities. Over the years, SyncraTec has compiled a list of recommended customizations to the out of the box Opportunity Sales Process that add a lot of value to opportunity management. And now, Dynamics 365 for Sales has added sales forecasting to increase the probability of success for your sales team even more! It’s beneficial for a sales manager to have access to a list view of open opportunities that their team is nurturing. Dashboards and charts can improve the data visualization of these opportunities by such things as Estimated Revenue, Estimated Close Date and Probability. But, a sales forecast can help a sales team track their performance against their targets and identify risks to achieving their quotas. My previous blog highlighted how simple it is to set up and configure a sales forecast for your organization in Dynamics 365. This blog will demonstrate how sales team members and sales managers can use forecasts to achieve their sales goals. All of the functionality discussed in this blog comes FREE with Dynamics 365 for Sales, along with some additional Sales Insights functionality. Viewing and Adjusting a Forecast as a Sales Team Member A sales manager needs to have the Forecast Manager security role to configure forecasts for their organization. They can set up the type of forecast, permissions for accessing it, and the columns they want displayed on the forecast grid. After a forecast is activated, the sales team members can access the projected revenue and pipeline predictions accumulated from their opportunities. A sales team member will find forecasts in the Performance area of the navigation menu of the Sales Hub app. The drop-down list of forecasts at the top will display any forecast for which the sales team member has permissions to view. From the next drop-down list, they can choose the forecast period they want to see. These options reflect the forecast periods defined in the forecast configuration. The Forecast Grid The forecast grid displays all relevant columns as defined in the forecast configuration. The totals are aggregated by user or by territory, at each level of the hierarchy and for each period according to the forecast column attributes. The forecast illustrated in this blog was configured as an “org chart forecast”. It also uses the out-of-the-box Forecast Category option set from the Opportunity entity for column configuration (recommended by Microsoft). As a sales team member, the forecast grid summarizes opportunity values from a snapshot of the data. The upper right corner may indicate that “Fresh data is available”. Dynamics gives the user the option to update the grid with the real time values from their Opportunity records. It will include Opportunities where the user (sales team member) is the Owner and the Estimated Close Date falls within the forecast period. The default value for each column is the sum of the Estimated Revenue fields for all the Opportunities with the Forecast Category value indicated by the column name. Note: There are some changes around snapshot history in Dynamics Release 2020 Wave 2. Underlying Opportunity Records At the bottom of the forecast, you will see the underlying Opportunity records in the Opportunities Forecast View. This is the out-of-the-box default view, but it can be changed when the forecast is configured. From this Opportunities Forecast View, the sales team member can: Update the “Forecast category” column to: Pipeline – indicates with low confidence that this Opportunity will be closed as won during the forecast period (default value for new Opportunities) Best case – indicates with medium confidence that this Opportunity will be closed as won during the forecast period Committed – indicates with high confidence that this Opportunity will be closed as won during the forecast period Omitted – identifies an Opportunity that the user wants to be excluded from the estimated revenue forecast values Note: An out-of-the-box workflow automatically updates the Forecast Category to Lost or Won when an Opportunity is closed as lost or closed as won. Update additional Opportunity fields, such as Topic, Potential Customer, Est. Revenue, and Est. Close Date. Select “Show as Kanban” to display the underlying records in a Kanban type of view to easily drag Opportunity records from one Forecast Category to another. Select “Expand” to see more of their Opportunity records at one time. Navigate to the Opportunity record by clicking on the icon in the “Actions” column on the far left. The Opportunity form is opened in a new window to allow the update of any Opportunity record field while staying within the context of the forecast grid. Adjusting the Forecast The columns in the forecast grid can be configured different ways. It is up to the sales team manager to design the forecast grid to facilitate getting the most out of the forecast for their business. The forecast grid created for this blog provides the following functionality: Clicking on a Forecast Category column in the forecast grid will filter the view of underlying Opportunities accordingly. Column descriptions appear as tooltips on the column header to help the users understand what that value represents. Specific columns, like Committed in this forecast grid, have been configured to allow manual adjustments to the system-calculated values. Specific columns, like Pipeline in this forecast grid, have been configured to display a progress bar indicating the attainment percentage compared to the quota column. From the Underlying Records view, a user can modify the individual Opportunity Forecast Category directly in the view. When this occurs, the Estimated Value of the Opportunity will be subtracted out of the previous Forecast Category roll up value and added to the new Forecast Category roll up value. Adjustment Dialog Box There may circumstances where the sales team member estimates the amount that they expect an Opportunity to bring in at the close of a forecast period to be different from the roll up
How to Set Up a Dynamics 365 Sales Forecast Model (Part 1)
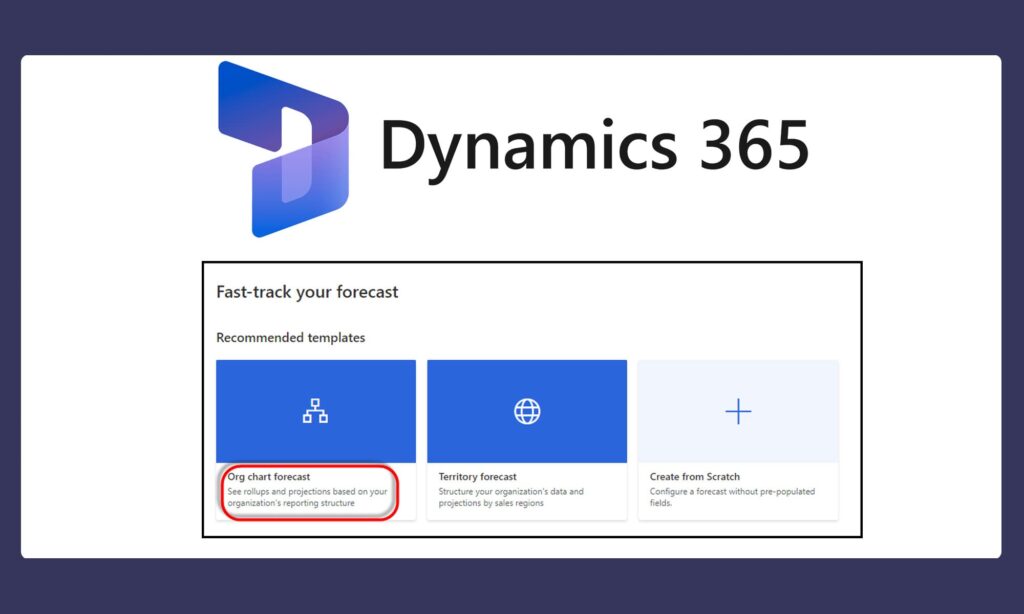
How to Set Up a Dynamics 365 Sales Forecast Model (Part 1) A sales forecast can help sellers track their performance against their targets and identify risks to achieving their goals. This blog (Part 1) is going to highlight how easy it is to set up a sales forecast for your organization in Dynamics 365. All of the functionality discussed in this blog comes FREE with Dynamics 365 Sales, along with additional Sales Insights functionality. By default, the sales forecast model is available in your organization. You need to be an administrator or have the Forecast Manager security role to configure forecasts in your organization. You can set up the type of forecast, permissions for accessing it, and the columns you want displayed on the forecast grid. After a forecast is activated, your sales team can access the projected revenue and pipeline predictions. Getting Started with Your Sales Forecast Model You can set up Dynamics 365 sales forecast models based on your organization’s reporting hierarchy, your organization’s sales regions or some other hierarchy entity. For this blog, we are going to base our forecast on our organization’s reporting structure. Note that this method assumes that Manager (User lookup) fields are already updated on User records. From the App Settings menu of the Sales Hub, select “Forecast configuration”, then choose the “Org chart forecast” template. General Properties The template is a wizard-like tool that will guide you through the configuration of your org chart forecast. Here is a list of the properties you will need to identify. Forecast name – enter a meaningful name Rollup entity – this is set to Opportunity by default and cannot be changed Hierarchy entity – this is set to User by default and cannot be changed Rollup to hierarchy relationship – defines the relationship between the rollup entity and the hierarchy entity (e.g. Owner) Top of hierarchy – for org chart forecasts, provides a drop down of Users – select the Manager – after you select the Manager, the Preview window on the right will show the hierarchy Default underlying records view – provides a drop down of Opportunity views – this is the view used when users select a row or a cell of the forecast to view its underlying Opportunities (more about this in Part 2 of this blog) Forecast period – select whether the forecast is generated monthly or quarterly Fiscal year – select the fiscal year for the forecast – this is populated based on the organization’s fiscal year settings Start this forecast – select the time period to start forecasting – Number of periods – enter the number of forecast periods to be generated – you can only create forecasts that span up to one year Valid from – read-only field – it identifies the date the forecast starts Valid to – read-only field – it identifies the date the forecast ends When you are done, click on the “Next” button. Permissions In the Permissions step of the forecast wizard, you identify which users can view and adjust the forecast data at each level. Also, you can provide access to users who have specific security roles to view the forecast. In the User security field section, the User lookup field will default to “User” for org chart forecasts. This field determines the owner of the row in the forecast grid. If you select a value other than the default, a column is created in the forecast grid. The Additional security roles section provides options to give permissions to users outside of the organization hierarchy. By default, “No additional security roles” is selected. Layout and Columns In the Layout step of the forecast wizard, you can configure columns to define the rows in the forecast grid. Every forecast needs an option set to define roll-up columns. You can add roll-up columns based on option set values that are defined for your Opportunities. Click the + Add from option set to get a list of the option sets defined on the Opportunity entity. Select an option set, and then click on Choose selected. Each option set value you select is added as a column for you to configure. Forecast Category Microsoft recommends using the out-of-the-box Forecast Category option set for column configuration. Forecast Category is an out of the box field displayed on the Opportunity form. It is used to define the confidence level of an Opportunity closing as a win. It defaults to “Pipeline”. You can add custom option set values, if you’d like. As you can see below, the Forecast Category options include Won and Lost. The Opportunity Forecast Category Mapping Process is an out-of-the-box workflow that automatically updates the forecast category when an Opportunity is set to Won or Lost. If you’re using a custom option set for column configuration, you must create a workflow to ensure that the forecast is projecting accurate values. After your columns are added, you can configure each one by clicking on the vertical ellipsis and selecting Configure. This will give you the ability to modify the column Name set the column Type (typically Rollup) define the Amount field (what you are rolling up, typically the Estimated Revenue) define the Date field (the date used to determine the forecast period, typically the Estimated Close Date) add a Description (this appears as a tooltip on the column header of the forecast grid) set Allow adjustments (to let users manually edit a system-calculated value directly in the forecast grid, indicated by a pencil icon) enable Show progress compared to quota (to compare the column’s value against the quota column indicated by a percentage shown in a progress bar) set Show in Trend Chart There is an Auto-Configuration option that would do a lot of the column configuration for you. You can always tweak it afterwards. Additional Filters By setting additional filters, you can filter the Opportunity records used to calculate the forecast values. The filters are based on attribute values that belong to the Opportunity entity, including related entity attributes. Activate &